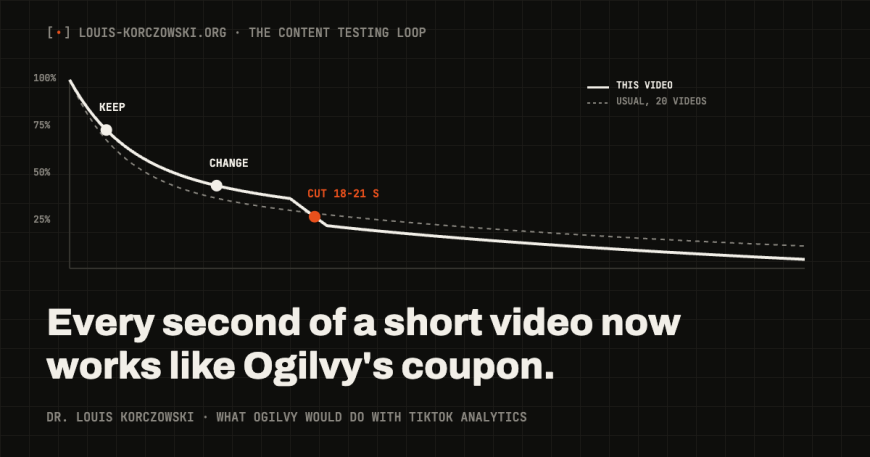
A line widely attributed to David Ogilvy says it all: “Never stop testing, and your advertising will never stop improving.” In his time, a test meant two versions of a print ad, a coupon at the bottom of the page, and weeks of waiting for the mail. Today TikTok shows you, second by second, the exact moment people left your video. Ogilvy would have loved it.
I am a PhD in machine learning and neuroscience, and I have run this testing loop by hand with clients for years. This week, a creator rebuilt it with an AI assistant in a 69-second video, and showed that an AI assistant can now do the analysis. So the question for a founder becomes very concrete: if the AI reads the data, what is left to do, and how do you avoid fooling yourself?
TL;DR
- Ogilvy’s direct-response rule (measure every ad, keep the winner) finally reached video, with retention measured second by second.
- Alex Hormozi spent $4 million over about 40 months on his content operation. In my reading, the money bought more throws and people to read them.
- An AI assistant can now compare two videos passage by passage and propose the exact cut. The analysis became the cheap part.
- Two videos prove nothing. A testing loop needs evidence rules: mature data only, your own archive, examples and counterexamples.
- The expensive part stays the same: ideas worth testing, and the courage to kill a format you like.
Ogilvy’s closed loop finally reached video
Ogilvy came to advertising through door-to-door selling and audience research. In 1938 he spent a year at George Gallup’s Audience Research Institute, and even as the most famous brand builder of his time he kept a deep interest in direct marketing. In direct response, every ad carried a coupon, every coupon was counted, and the winning version got the budget. Call it a closed loop: you publish, you measure, you change one thing, you publish again. Most brand advertising lived in an open loop: you publish, you hope, and someone explains the results afterwards.
Video stayed in the open loop for decades. A TV spot gave you a reach estimate and a sales curve weeks later. Short-form video closed the loop. For every video, TikTok’s creator analytics show views, average watch time, the share of viewers who watched to the end, traffic sources and the moment viewers lost interest. Instagram and YouTube give creators their own retention graphs. Every short video is now a direct-response ad with its own coupon.
What Hormozi’s millions actually bought
In September 2024, on episode 750 of The Game, Alex Hormozi said that over about 40 months he had spent $4 million on team, equipment, vendors, studios and software. In the same period he recorded about 1,000 hours on camera and published 35,000 pieces of content. Online, the number often travels as four million in four years, or even in one year. The source says three and a half years, and gives no split between production and testing.
The interesting part of the episode is how he learned. He produced as much as he could, then compared his 12 weakest and his 12 strongest recent videos, and rewatched his best educational videos to study their openings. That is a post-mortem, done by hand. I wrote about Hormozi before, about what his reputation teaches marketers, and this is the side of him I respect most: he reads his own data.
People repeat the number as if it were the secret. In my reading, the money bought two things: more throws, and people to read them. Angus sums it up on one of his screens: a team that publishes a lot gets more feedback, decides better for the next batch, and improves the ideas, the packaging and the introductions. Ok, I know, most founders do not have that budget. Until this year, that was what made testing a luxury: someone had to sit with the analytics every week and write down what changed.
The loop, rebuilt with AI in 69 seconds
On October 22, 2026, Angus Sewell, who posts as Angus the Nontechnical, published his version of Hormozi’s system, built with Claude. The voice-over is quick, and the real system is on the screens.
Here is what the screens show, in order:
- A data pipeline. Post test videos, read the TikTok Studio analytics, keep the latest metrics and a dated history of every reading.
- A video post-mortem. The AI reads both transcripts, the on-screen text and the retention curves, compares each passage with the creator’s better-performing posts, and answers with KEEP, CHANGE or CUT plus the exact edits. Speculative changes are labelled as tests.
- Two versions. The re-edit and the original go out as test posts (Instagram calls them Trial Reels: they are shown to non-followers first), and the winner goes to the main feed.
- A learning session. The AI re-tests the lessons already saved before adding new ones, shows examples and counterexamples, and writes lessons into a table. Some lines in his table say REFUTED.
- A coach. The report goes into NotebookLM, renamed Gemini Notebook in July 2026, which turns it into an audio overview that comments on the next tests.
His best idea is one rule. A retention curve measured before day 7, below 1,000 views, or without measurement details stays “early data”, and the comparison stays neutral. That rule protects you from the biggest trap in content analytics, which is reading a story into noise.
I ran this loop by hand for a pizzeria
When I watched it, I laughed, because it is the loop I have been running by hand with clients. The clearest case is a pizzeria with 25 seats. Its owner, Tonton Giovanni, was 57 and believed the secret was hashtags. From January 2024 to April 2026, more than 400 of his videos were edited, and his account went from 2,000 to 1 million followers in two years. He is at 1.6 million today.
The loop was the same: we shot in batches, read the numbers, kept the formats that landed, changed one thing on the formats that hesitated, and retired the ones that kept falling. I call it the dice system: a video is a throw, and a format is the die you throw again and again.
That is also where my method and Angus’s system differ, and complete each other. His post-mortem works on one video: it tells you which sentence to cut. The dice review works on the format: it tells you which shape of video deserves another hundred throws. The AI is excellent at the first job. The second one is a decision.
Can you trust a comparison between two videos?
Rarely, and the reasons are statistical.
Views are very unevenly spread. In one large YouTube study, the top 10% of videos drew nearly 80% of the views. So one video that explodes says little about the next one. After an unusually good video, the next one tends to land closer to your average even if you changed nothing, a classic trap called regression to the mean. And if you keep checking a test and stop as soon as it looks good, you fool yourself often: in Evan Miller’s worked example, testing after every observation and stopping at the first significant result pushed false positives from 5% to 26%.
So a testing loop needs rules before it needs dashboards. Angus’s system already applies some of them: his dashboard compares each passage with 20 earlier videos, and his prompt keeps signals apart and looks for counterexamples. Here are the four rules I use:
- Mature data only. Use Angus’s early-data rule: a week and a minimum of views before any verdict.
- Your own archive. Compare a video with your comparable videos, same platform, same format, similar length. Industry averages tell you very little about your account.
- Signals apart. Retention says people stayed. Saves say they want to come back. Shares say they want someone else to see it. The platforms weigh them separately too: TikTok treats finishing a longer video as a strong signal of interest, and Instagram’s Adam Mosseri names watch time, likes and sends as the top three signals. Merging them into one score hides the lesson.
- Examples and counterexamples. An explanation counts when it holds on several videos and survives the videos that contradict it. Otherwise it is a hunch, and you write the word hunch.
Should you automate TikTok Studio?
Angus’s pipeline signs in to TikTok Studio with a saved browser session and reads the analytics page. Before you copy that part, read TikTok’s terms. The US version forbids using any automated system to scrape, crawl, export or extract data from the platform without TikTok’s written approval, and I found no exception for your own account. The public Display API gives views, likes, comments and shares, with no retention field. Retention through an API goes through TikTok’s business tools and approved connectors.
You need none of this to start. A spreadsheet and ten minutes per week are enough: one row per video, the numbers copied from the app on day 7. Automate later, with the platform’s official tools where they exist, and keep your password in your own hands.
What AI will not do for you
The AI reads the curve, and the idea still has to come from you. In my experience the leverage sits in four layers: the idea, the packaging, the format and the edit. A post-mortem mostly fixes the edit and part of the packaging. When every video of a format loses half its viewers in the first two seconds, no cut will save it: the promise is wrong, or the idea is.
The second thing the AI will not do is kill a format you love. That decision costs a week of work and a bit of ego. Voilà, this is the job that stays human: deciding what deserves to be thrown again.
How to run the loop this week
- Open one table, one row per video: platform, date, format (e.g. founder story, myth vs data), hook, length, views, saves, shares, retention at 3 and 10 seconds, and the date you read the numbers.
- Tag every video with its format and its type of hook. Without tags, an archive is a pile.
- Wait seven days before any verdict.
- Once a week, run a post-mortem on your most surprising video, the best or the worst, against ten comparable ones.
- Re-edit one video with one to three changes, and test it against the original in comparable conditions. On Instagram, Trial Reels shows the re-edit to non-followers first, and you compare the numbers. TikTok’s split testing covers ads only, so on TikTok post the re-edit at the same hour and weekday as the original, and compare day-7 numbers.
- Once a month, hold a learning session on the whole archive. Re-test the old lessons first, then add new ones with their evidence.
So here is my question for you. Which of your formats would you kill today if the data asked you to, and which one would you defend against the data?
Ogilvy tested to find the best ad, and founders can now test to find their best ideas, with an AI that reads the score.
FAQ
What is a content testing loop?
A weekly routine where every video is measured against your own comparable videos, one change is tested at a time, and the lessons are written down with their evidence, so each video teaches the next one.
How many videos do I need before I trust a result?
Judge a format on at least ten mature videos, and a single change on a test you decided before posting. With fewer videos, describe what you see and keep the conclusion for later.
Which metric matters most on short-form video?
Read them apart: retention, saves and shares answer different questions. For reach, platforms say completion and sends weigh heavily. For a founder, shares and the leads they bring matter more than views.
Do I need to code to run this with AI?
No. A spreadsheet, exported numbers and an assistant with the right prompt are enough. The handbook below gives the prompts and free skills.
Dr. Louis Korczowski is a short-form content strategist for SaaS and AI founders, with a PhD in machine learning and neuroscience. The handbook version, with prompts and open-source AI skills: The Content Testing Loop.